Alligator Indicator
The Alligator indicator stands out as one of the most intriguing trend indicators. Introduced by the renowned trader Bill Williams, the author of chaos theory, this indicator is peculiar not only due to its name but also because it possesses animal-like qualities. It can either "sleep" or "open its mouth" when hungry. These two properties of the indicator hold practical significance — they serve as trading cues, indicating when to refrain from trading (during the alligator's sleep) or when to trade in the direction of its open mouth.
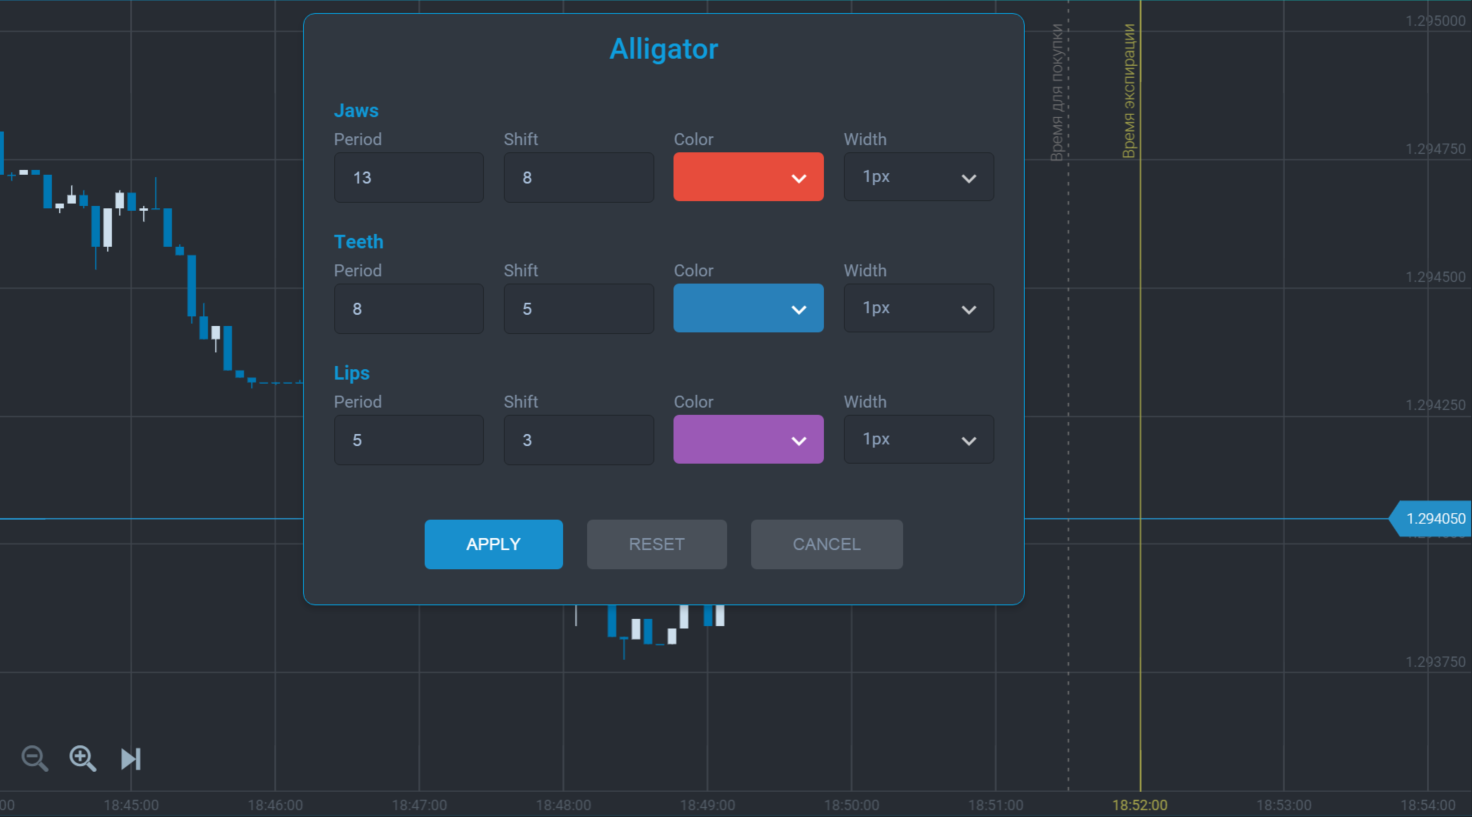
Let's delve into its mechanics. The first essential piece of information is that the indicator is based on three moving averages with different periods displaced by a certain number of bars. The standard settings for the indicator are as follows:
-
Alligator’s Jaw: 13-period smoothed moving average (SMMA) built on the average bar value and shifted into the future by 8 bars.
-
Alligator’s Teeth: 8-period SMMA built on the median price and shifted into the future by 5 bars.
-
Alligator’s Lips: 5-period SMMA shifted into the future by 3 bars.
Here is an example of the Alligator settings during installation:
On the chart, the Alligator indicator will appear as follows:
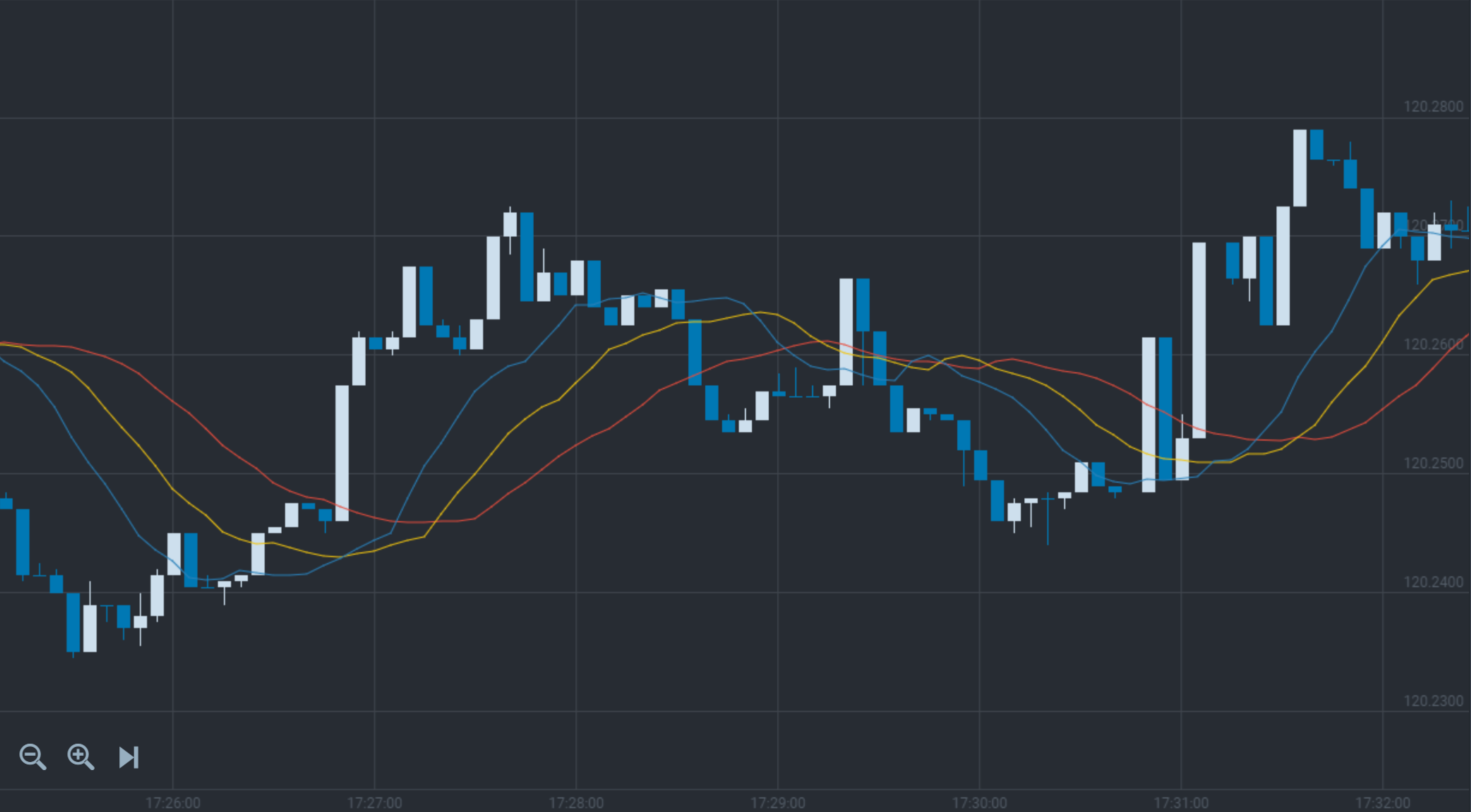
This indicator was developed to eliminate false signals during non-trending periods. Moving averages can produce numerous false signals in flat markets. As anticipated by the Alligator's author, the modified averages shifted into the future to enable timely initiation or cessation of trades. To comprehend this, one needs to grasp the cycles of the Alligator's sleep and wakefulness.
The primary signal to buy calls or puts is the "opening of the mouth" — the moment when the averages start to separate to different sides and cease crossing. The direction of the trade is determined by the averages' direction: an upward movement signals online trading, while a downward movement indicates buying puts. The signal to close a deal is the "closing of the mouth" — the moment when the moving averages commence closing and crossing. An example on the chart illustrates this:
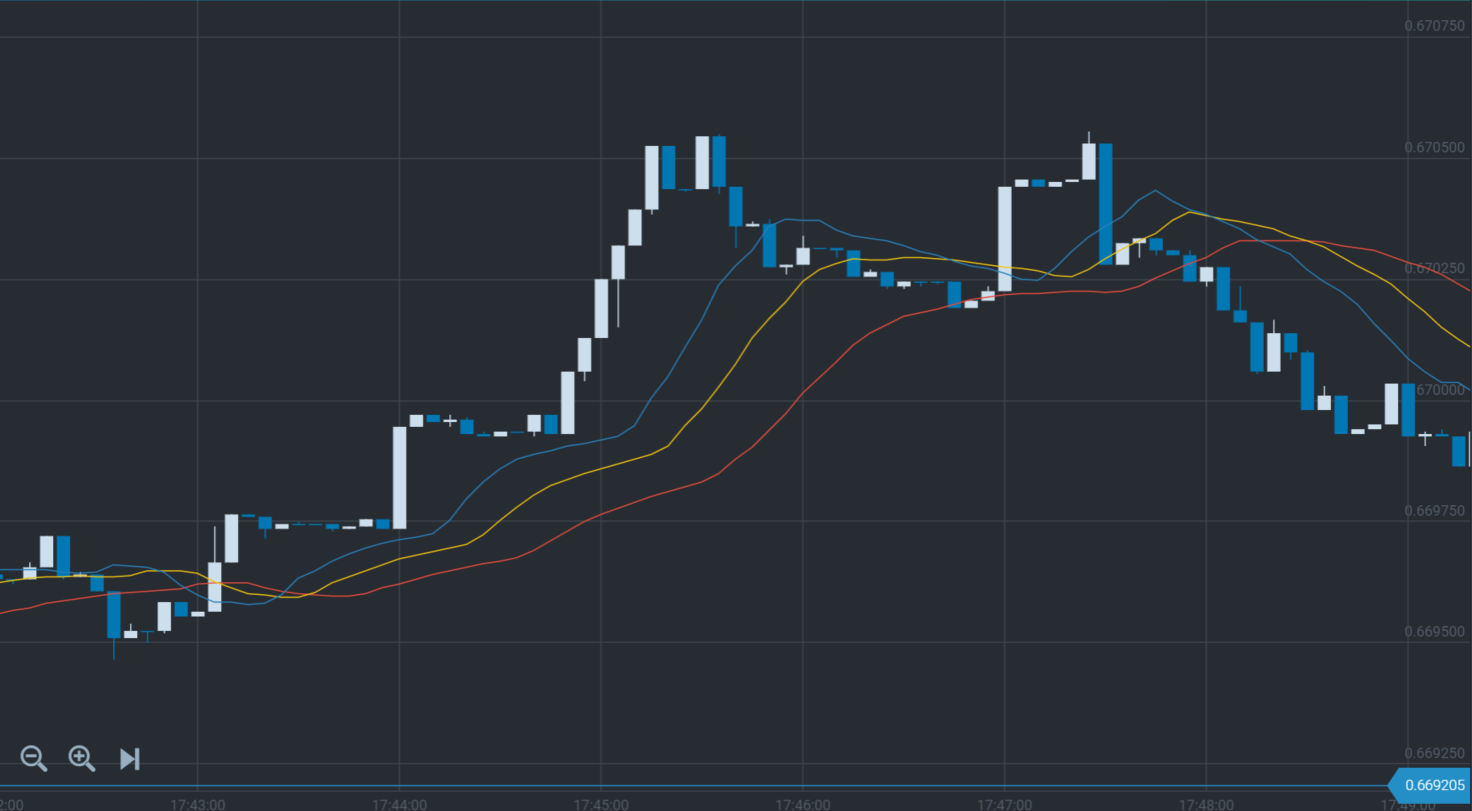
Initially, it may seem complex, but if we recall the method of working with three averages, we observe a similar situation — the fast average crosses the slower one, providing a trade signal. If the price chart is above the indicator, we trade online. But when the chart is below the indicator, we can buy puts.
To comprehend how the indicator operates, we recommend installing it on your chart and testing its signals on historical quotes. This practice helps you become accustomed to a currency pair and understand its signals. You can also observe trading cues on a real-time chart.
Engaging in online trading at small intervals allows you to grasp how the indicator performs on a specific trading instrument. Once you understand how to initiate trades, you will begin to earn. However, always bear in mind: refrain from trading while the Alligator is sleeping.